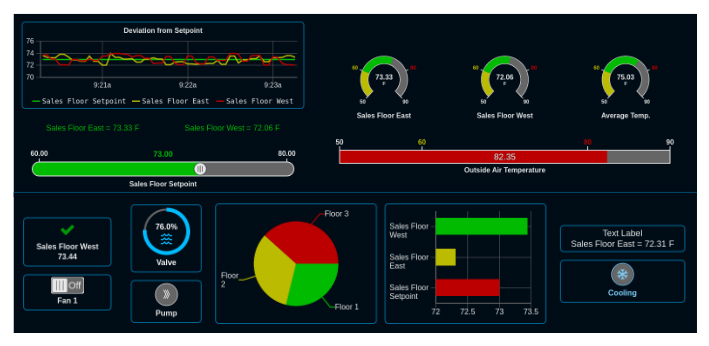
BASview Graphics/Dashboard

To obtain a more understandable view of the process or equipment, graphics with embedded tags and values are created for viewing in a browser window.
The BASview Series supports two types of "graphics", one is the traditional graphic where you have images and values from points and some animated elements. The position of the elements on the screen are fixed. The other is a Dashboard. Here the position of the elements are not fixed and can move based on the display resolution. This works very well on smaller displays such as smart phones or tablets.
Graphics/Dashboards are used to display system information and to control equipment. Edit mode is only available to users given permission to edit graphics. Several Components are available — including text labels, check boxes, animations, etc. To add an item to a graphic, drag it from the device tree to the graphic area — then a dialog appears for choosing a component to use with the item. To change the point attached to a component, drag the new point from the device tree and drop it on the component. Components may be copied and pasted between graphics.A Graphic on the BASview2 has a few elements to select from such as animated elements, buttons, images and displayed values/text. A Dashboard has more elements such as animated elements, buttons, bar charts, pie charts, strip charts, gauges, images, schedules, switches, and trends.
Back to BASview